
Data visualization plays a crucial role in conveying the covert message laid in the large amounts of data to the audience. Not only the message should be right to the point and easy to understand, visualization should be designed according to the needs of the audience. Questions such as “who” will be looking at the visualization and “why” are we making such visualization should be asked at the first place which leads the designer to gain an understanding over the user, and to design the report to fulfill users’ needs and preferences in an appropriate fashion.
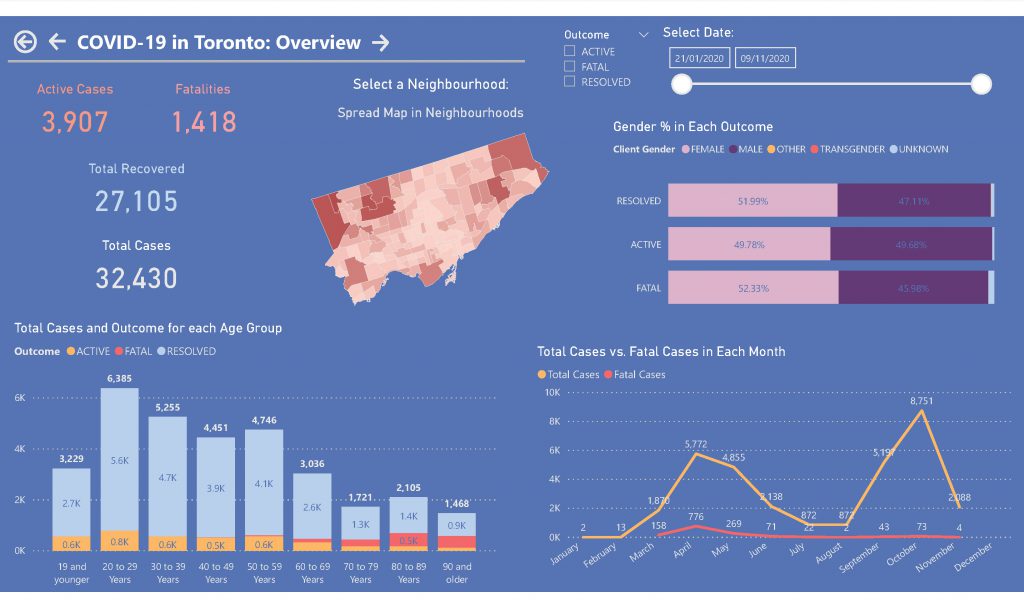
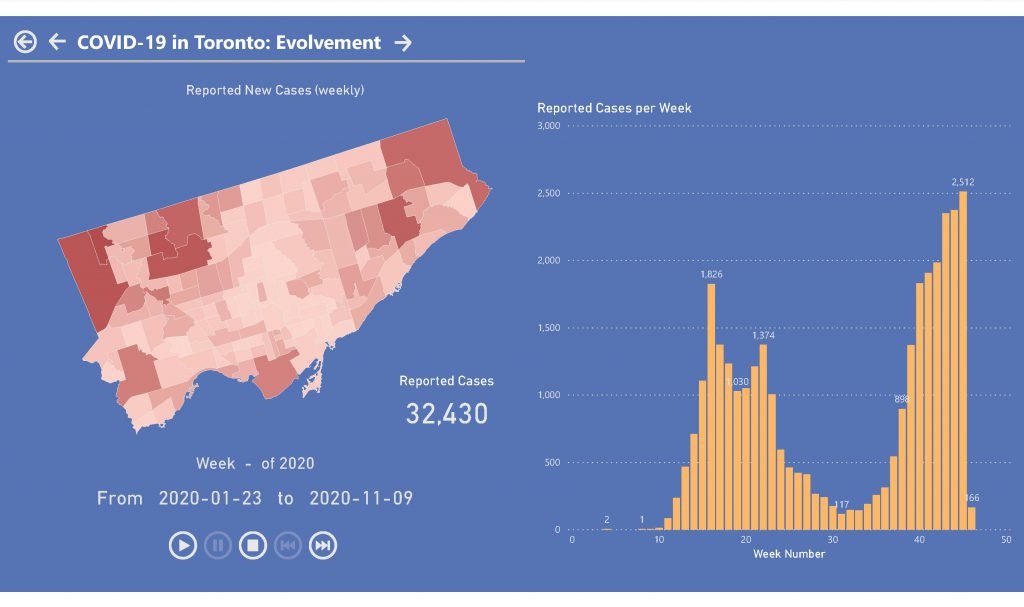
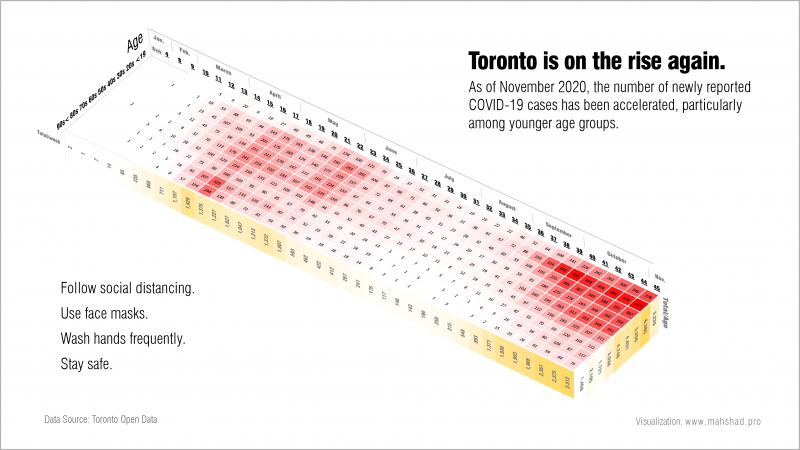
In this visualization, the City of Toronto’s COVID-19 dataset is analyzed through different points of view. A location-based evolvement is visualized to represent how was the spread evolved through the weeks of the year.
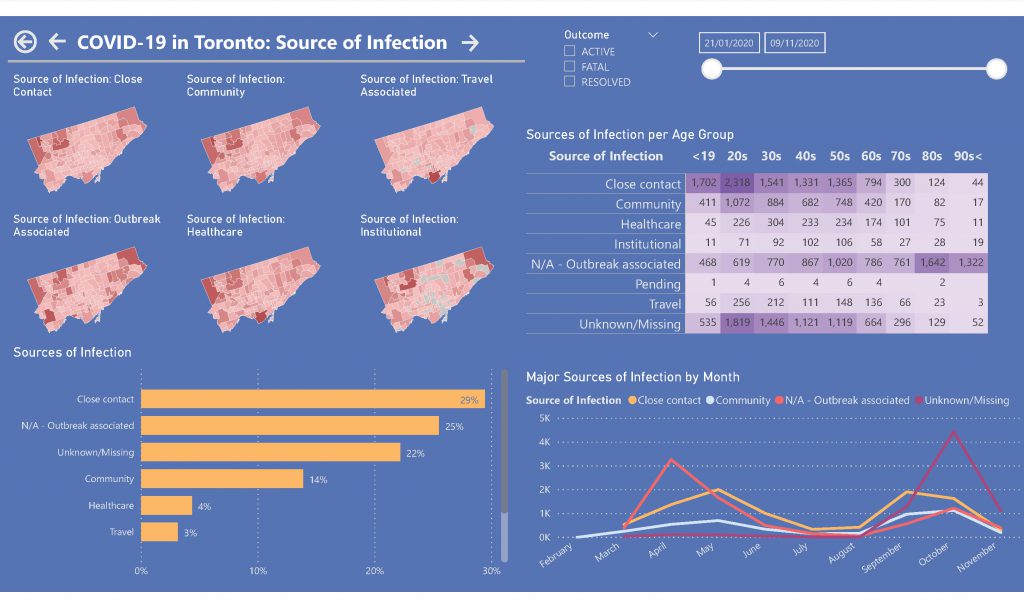
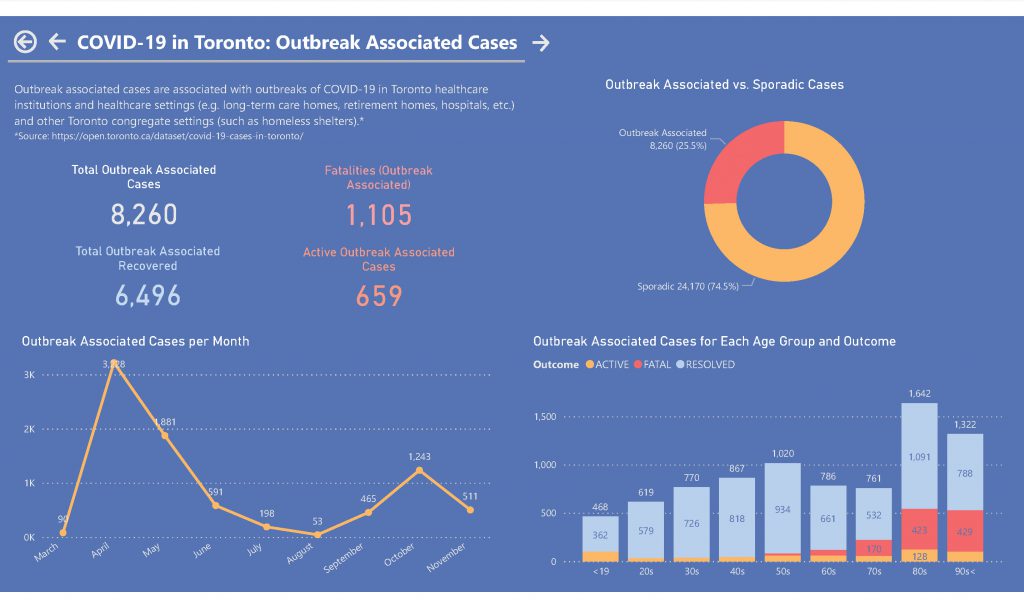
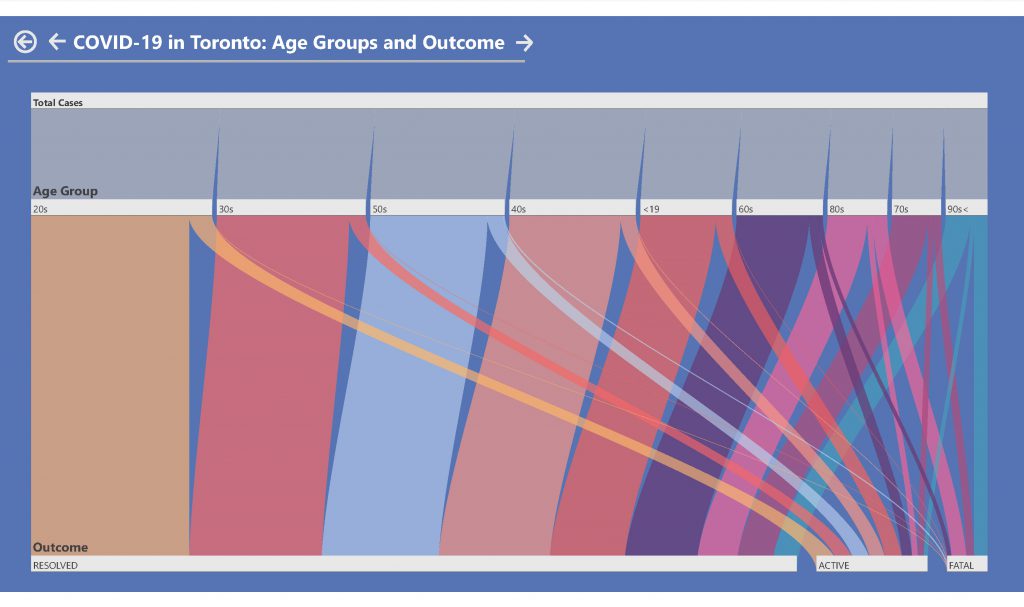
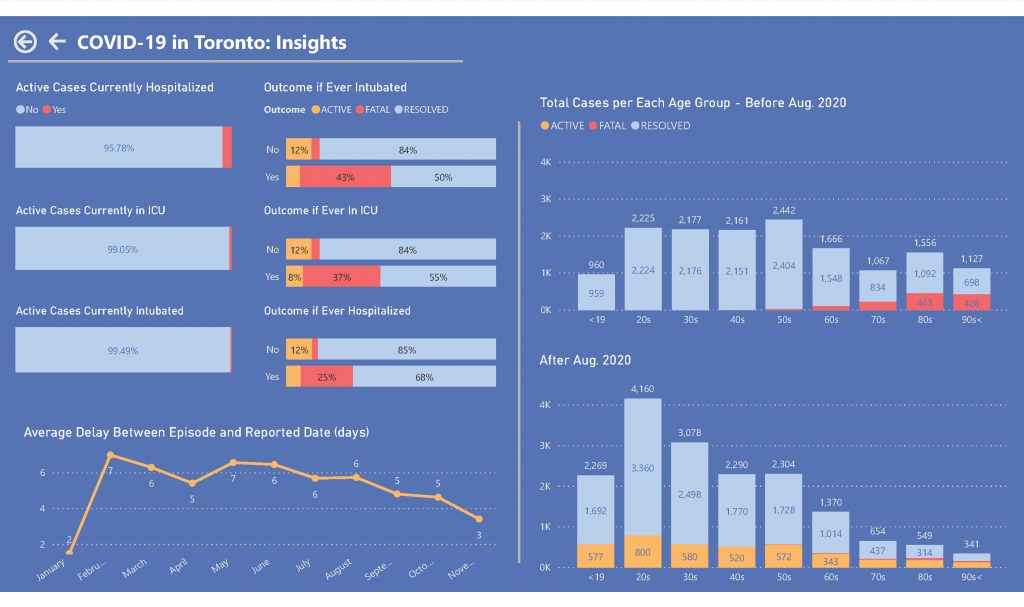
Other insights such as different sources of infection, Age and outcome, and outbreak associated cases are also available in different pages for further analysis:
The live dynamic version of the dashboard can be accessed here:
COVID-19 in the City of Toronto Dashboard
Data Source: Toronto Open Data


3 Comments
Add Yours[…] I was working on a reporting dashboard visualizing Toronto’s COVID-19 data. The dataset in use is from Toronto’s Open Data which is being updated and published on a […]
Thank you!!1
[…] I was working on a reporting dashboard visualizing Toronto’s COVID-19 data. The dataset in use is from Toronto’s Open Data which is being updated and published on a […]